


Agriculture remains a foundational part of Europe’s food system, even as its economic weight continues to shift across countries. The ‘Key figures on
the European food chain – 2025 edition’, published in December, follows food’s journey from farm to fork—covering production, processing, distribution, trade, consumption, and environmental impacts. One of its key insights: the value added by agriculture across the EU.
Agriculture’s share of the EU economy
In 2024, agriculture accounted for 1.2% of GDP in the European Union. While that may sound modest, it represents a 0.1 percentage point increase compared with 2009, showing that agriculture has slightly strengthened its relative position over the past 15 years.
Big differences between EU countries
The economic importance of agriculture varies widely across member states.
Greece recorded the highest share, with agriculture contributing 3.2% of GDP.
Romania (2.5%) and Spain (2.3%) followed closely behind.
Bulgaria, Italy, and Croatia each reported agricultural value added of 1.8% of GDP.
At the other end of the scale, agriculture plays a far smaller economic role in several countries. In 12 EU member states, it accounted for less than 1% of GDP, with Luxembourg and Malta recording the lowest shares, at just 0.2% each.
Long-term trends: who’s gaining, who’s losing?
Between 2009 and 2024, agriculture increased its share of GDP in 15 EU countries. The strongest gains were seen in:
- Greece, up 0.9 percentage points
- Latvia, up 0.6 pp
- Spain, up 0.5 pp
However, not all countries followed this upward trend. The agricultural sector’s relative importance declined most sharply in:
- Romania, down 2.2 pp
- Bulgaria, down 1.4 pp
- Malta and Croatia, both down 0.7 pp
Why these figures matter
Gross value added from agriculture offers more than just a snapshot of farm output—it highlights structural changes in national economies, shifts in productivity, and the evolving role of farming within Europe’s wider food chain.
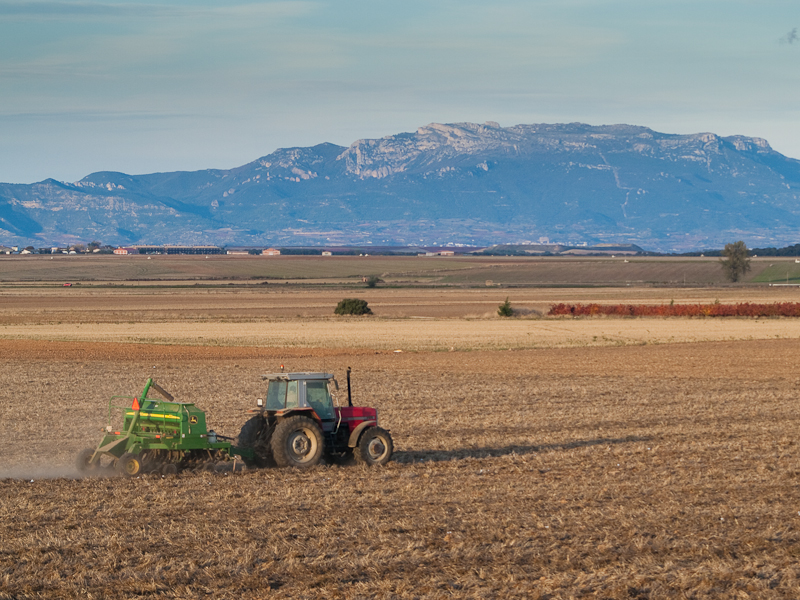
The ‘Key figures on the European food chain – 2025 edition’ provides a comprehensive data set for comparing developments across EU and EFTA countries, helping policymakers, researchers, and industry stakeholders track long-term trends. For deeper insights into other areas of EU performance, readers can explore the wider collection of ‘Key figures’ publications. Photo by Raúl Hernández González, Wikimedia commons.